In this post, Sandro reflects on the importance of soft skills for data professionals. Skills like storytelling, data visualisation and business acumen don’t just help to convince stakeholders of the validity of your projects, they help you frame the problem even before you prepare the data. Sandro offers some practical tips to enhance your soft skills and make a real impact within your organisation:
Your data analysis is comprehensive. Your dashboard is ready. Your machine learning model is accurate. Yet, nothing seems to be happening. The issue does not lie in the code or data but within the people dimension. The good news is that you, as a data scientist/analyst, can tackle this challenge by enhancing your soft skills. This article provides tips and tricks to enhance the impact of your data initiatives. The content is divided into five key soft skills categories: data visualisation & storytelling, communication, stakeholder management, adaptability, and business acumen.
By training, we – data scientists – are better with technical skills simply because existing academic curricula mainly focus on statistics, machine learning, and programming skills. However, improving your soft skills will definitely boost your impact within companies.
Let’s remember that all data initiatives need to start with a question. As Hilary Mason stated very well: ‘The truth is that framing the questions is where the challenge is. Finding the answers is generally a trivial exercise or an impossible one.’ One of the key reasons soft skills are important is they enhance our ability to frame the problem before using any machine learning algorithm, or even preparing the data.
Additionally, we must keep in mind that data projects have an impact only if they are trusted and adopted by stakeholders. Being able to tell a story and convince these individuals is crucial to shift from an interesting proof of concept to a data product that benefits the company.
Part of data literacy is the ability to read and write data, visuals, and dashboards. Data visualisation skills are key to helping your audience grasp the insights from your data. The more you improve your visuals, the easier it is for your audience to understand your point. This also means that you must first know your audience. Before preparing visuals, ask yourself the following questions (see Figure 1):
● What matters to your audience?
● What questions might your audience have?
● What is the level of expertise of your audience?

You can also improve the efficiency of your plots with the following tips:
● Choose the right visualisation: Start by isolating the correct category (comparison, trend, etc.), select the most suitable chart type (scatterplot, bubble, etc.), and eventually fine-tune the options (axes, colours, etc.).
● Remove the clutter: Anything that is not strictly needed in the plot should be removed. Indeed, the more cluttered the graphs are, the harder they are to read. Adopt the motto: if in doubt, leave it out.
● Use preattentive attributes: Utilise whatever you can (colour, size, etc.) to highlight what you want your audience to focus on. The less time they need to think about your visual before getting to the point, the better.
● If you want to go one step further, consider the Gestalt principles (proximity, similarity, closure, etc.) which aid in designing dashboards, for example (see the book at the end of this article).
● A final point to keep in mind related to data storytelling is the distinction between data exploration and data explanation. While analysing data, you generate plenty of plots to gain insights; this is the exploration phase. Once complete, you move to the explanation phase, in which you tell a story by selecting and fine-tuning a tiny portion of these visuals. As proposed by Brent Dykes in his book Effective Data Storytelling , you are like Indiana Jones, both an archaeologist (exploration) and a professor (explanation).
Without communication, there is no adoption, and thus no impact. The classic approach is to start with what we do, then focus on how we do it, and – if we have time – discuss the why. A much more impactful approach is to start with why. This is well explained in Simon Sinek’s book Start with Why. Focusing on the why helps your stakeholders understand and adhere to your reasoning.
In terms of communication – and if you like acronyms – I suggest the 3Cs rule: communicate, communicate, and communicate. You must constantly share information about your data initiative – via newsletters, internal chats, and even paper notes – to key people. Another way to think about it is this: if people are asking about the status of your project, then you are under-communicating.
Finally, simplification – the art of making complex concepts accessible to a broader audience – is key to communicating with your audience. Keep in mind that your audience may not be familiar with your project, the tools you are using, or any acronyms you include in your slides.
Your stakeholders are all unique. Think of them as characters from Mr. Men and Little Miss; they all have different expectations. Here are three tips to better understand your stakeholders:
● Put yourself in the shoes of your stakeholders: Try to imagine you are them and predict what they expect from you.
● Ask yourself ‘what’s in it for them?’: If you want people to follow you, consider what benefits they will gain from it.
● Lead change before it occurs: Any data initiative introduces some form of change. Consider what actions you can take to facilitate this change for your stakeholders.
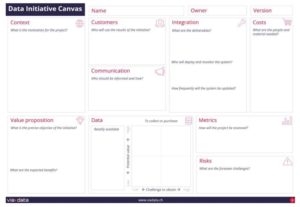
One of the biggest reasons for data project failure is the misalignment between data scientists and internal customers. One way to mitigate this risk is to use a canvas. Figure 2 is an example of the Data Initiative Canvas.

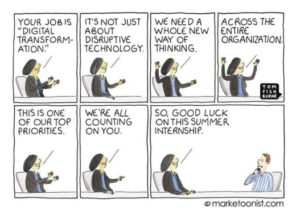
Discussion with your stakeholders is the best way to understand their needs. You would be surprised how often what they request is not what they truly need. Finally, setting the right expectations with your stakeholders, especially top management, is critical. In the data-driven transformation, the mindset shifts from strong scepticism (e.g., ‘this can’t be solved without our experts’) to unrealistic expectations (e.g., ‘AI is going to solve all our problems’), as depicted in Figure 3.

As data scientists, we are accustomed to adapting to new tools or programming languages. Similarly, we should adapt our approach to problem solving. There is a tendency to overuse machine learning (ML) – the hammer – and attempt to solve every problem – the nail – with overly complex approaches. While a junior data scientist knows well how to use machine learning, someone more senior will also know when not to use ML.
Indeed, just because we have easy access to ML algorithms doesn’t mean everything should be solved with ML. When approaching a new problem, check with your stakeholders whether business rules are available. This could solve the problem much more easily than using ML.
Although not usually attractive to data scientists, leveraging off-the-shelf solutions (low-code/no-code tools) can achieve fast impact with minimal effort. Certainly, you can now use generative AI to generate code for you, but start by considering whether you really need code at all.
Simple and imperfect solutions can have a significant business impact. As data scientists, we often seek complex and perfect solutions to our problems. However, it’s important to remember that companies operate in uncertain environments. Perfect accuracy isn’t necessary to generate impact, and a simple, easy-to-understand model is likely to have more impact than a complex, opaque model.
With the recent excitement around generative AI (as was the case with deep learning) it’s easy to lose sight of the business objectives and focus solely on finding exciting tools or algorithms to use. Remember, for your stakeholders, the impact is what truly matters, not the technology itself. When considering what generates impact in any data initiative, focus on how people understand what you do (and why), as illustrated in Figure 4.

One efficient way to build trust is by sharing the insights you generate while preparing and exploring data. Waiting until the end of the project to share predictions or forecasts with your stakeholders is risky, as they may not accept such figures if trust has not been established. By sharing insights about the data –which often your customers are unaware of – you create value for them as they learn something new.
Finally, creating impact is about transitioning from technical results (such as accuracy and ROC curves) to business metrics (like revenue generated and cost reductions). Strive to shift from machine learning outputs to business KPIs. These figures will help you gauge the real impact of your initiative on the company.
In conclusion, developing your soft skills is crucial, and complements technical competencies like statistics, machine learning, and programming. Emphasising soft skills recognises the importance of the human element in the data-driven transformation of companies. As discussed, enhancing abilities in areas such as data storytelling, communication, stakeholder management, adaptability, and business acumen can significantly increase the impact of your data initiatives.
So, how do you ensure your data scientists possess the necessary soft skills for the job? First, consider soft skills when hiring new data scientists. The usual interview process focuses on solving machine learning problems and writing code. Shifting some of this focus to soft skills will help you build a team with the right talents to make a significant impact within the company. For existing data scientists, soft skills can be developed through training (a course I am passionate about teaching) and by reading books on the topic, such as Business Skills for Data Scientists by David Stephenson. The future belongs to those who can not only analyse data but also inspire action, lead change, and drive business outcomes.